Update - NVT MAPS
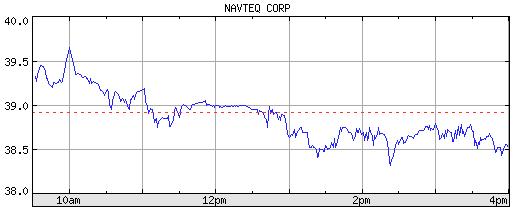
NVT traded lightly in the pre-market hitting a high of $40.25 at 8:32am and then traded at $39.50 right before the bell at 9:22am after trading at $39.94 after hours last night. The stock then opened at $39.27 at 9:30am and then hit an initial high of $39.45 at about 9:40am. The first dip took the price down to $39.20 a few minutes after the first high. The price then peaked again at 10:00am at $39.70 and saw a low later in the day of $38.31. So the ANGO no-short rule did seem to point out a situation where the first high and only slight drop was followed by a bigger spike up, but in the end the stock was deep in the red near the end of the day, but that can also probably be blamed on the overall market and not any Cramer effect.
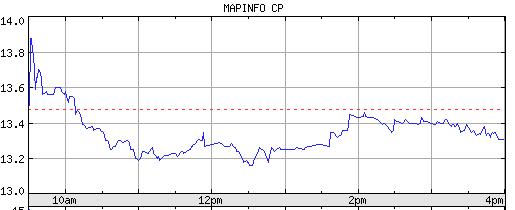
MAPS pre-market trading all happened a few minutes before the bell where a high of $13.79 was seen at 9:29am. The initial spike to close to $14 as I said I was looking for last night was found in the first minute of trading and was also the high for the day when it hit $13.99. Do I even need to point out the psychological price barrier seen here once again! The stock then saw a low for the day of $13.16 around 12:30pm, a drop of 5.9%.
As for Cramer's Speculation Index picks, all but 2 of them were down today. EZM was up 6-cents and was never in the red all day. IVAN closed even but was down a few cents during the day. So none of these really got much Cramer effect and really didn't show some of the insane price spikes as cheap stocks normally get when Cramer picks them. Probably a different story if he focused on one stock instead of 10.
posted by CramerTracker @ 6/09/2006
0 comments
![]()
![]()

Comments on "Update - NVT MAPS"
post a comment