Analysis Chart Updated
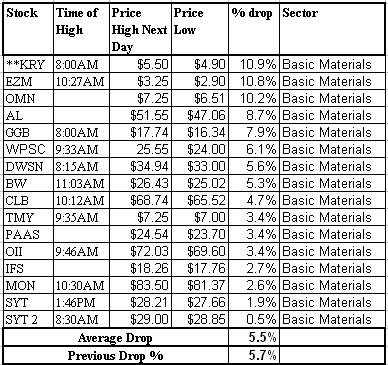
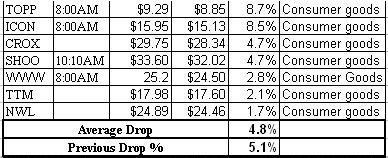
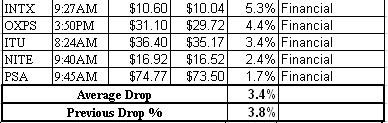
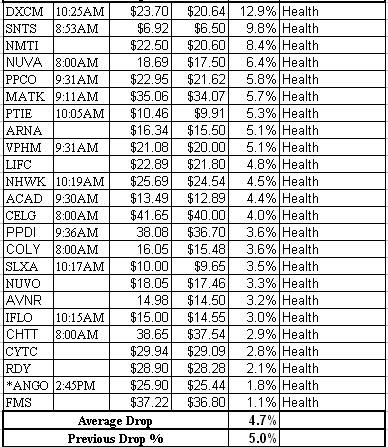
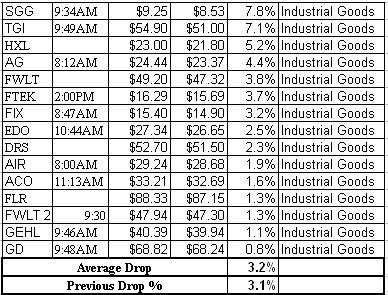
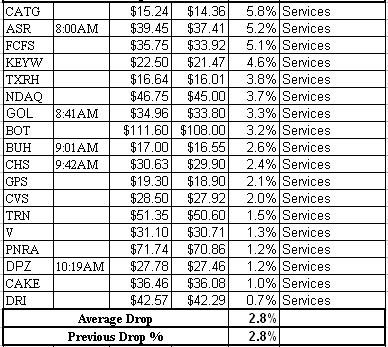
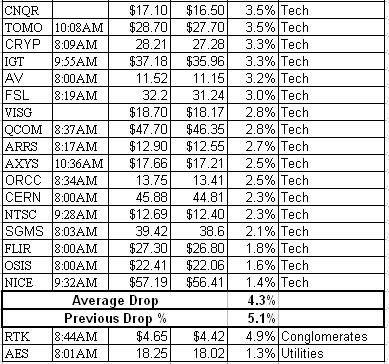
Below is a chart of Cramer's picks that I have tracked broken down by sector. The prices shown are from the next trading day after Cramer mentioned a stock including the pre-market. The chart does not include after hours prices right when Cramer picks a stock.
The ones with no "Time of High" are ones that I wasn't keeping track of time for at the time and wasn't saving the 1-day chart for and was before I created this blog. All the new picks should have a time. Also, the "Price Low" is always a low after the high.

posted by CramerTracker @ 5/21/2006
5 comments
![]()
![]()

Comments on "Analysis Chart Updated"
-
 Anonymous said ... (May 22, 2006 8:54 AM) :
-
 CramerTracker said ... (May 22, 2006 9:09 AM) :
-
 Anonymous said ... (June 14, 2006 9:36 PM) :
-
 CramerTracker said ... (June 14, 2006 9:40 PM) :
-
 Scarlett Hodge said ... (November 16, 2025 2:13 AM) :
post a commentJust wondering the ones with no times? What's up with those - and is it correct to assume the low price is after the high and on the same day?
Great job! Also the open price and the close price would be of interest to me, if possible.
Thanks
The ones with no times are ones that I wasn't keeping track of that data when I started tracking the picks and there was no way that I could go back and find that information, but I keep track of it as best I can now.
I also don't have all the open prices. I save screenshot of all the 1-day charts so I could estimate the pre-market open price, but I could certainly get all the regular hours open prices from Yahoo! Finance, as well as the close.
nice site...
cramer's show dying a slow death.
soon, he will be off air...then you will have to do something else here.
just my 2 cents.
I haven't heard how Cramer's ratings are doing lately, but I'm sure they must be down with the market being as bad as it is. I think we will know if his show is really coming to an end if they stop showing it 3 times a day...that would be a red flag for sure.
Thanks for the comment!
The updated analysis chart provides valuable insights.